
To deliver successful interventions, it is crucial for decision makers to understand where populations live in relation to public and private services.
To maximise the use of public and private sites and services, such as schools, health facilities, vaccination sites or mobile money agents, they need to be located where they can reach the largest possible share of the population.
Nowadays, detailed data on population distributions, roads and river networks, population mobility patterns and a range of other geospatial data are now available, which can help decision makers better identify service allocation issues. With these data, Flowminder has developed a new methodology to support decision makers in identifying the best locations for their services, and facilitate data-driven decision making.


Deciding where services, such as schools, vaccination centres or financial access points, should be placed is a classic but critical spatial problem in resource allocation.
Systematic ways to situate those services are especially helpful in contexts where resources are very limited and some populations or areas are marginalised.
Commonly asked questions within this problem include:
- Where to situate new service points to cover the largest number of people? Where to place staff to provide sufficient service capacity?
- What is the minimum number of service points we need to add to cover everyone? Or to cover 95%? If we add 100 service points, then what is the largest number (or %) of people that can be covered?
- Where to prioritise the set up of new services points or upgrade?
Experience our proven optimisation solution
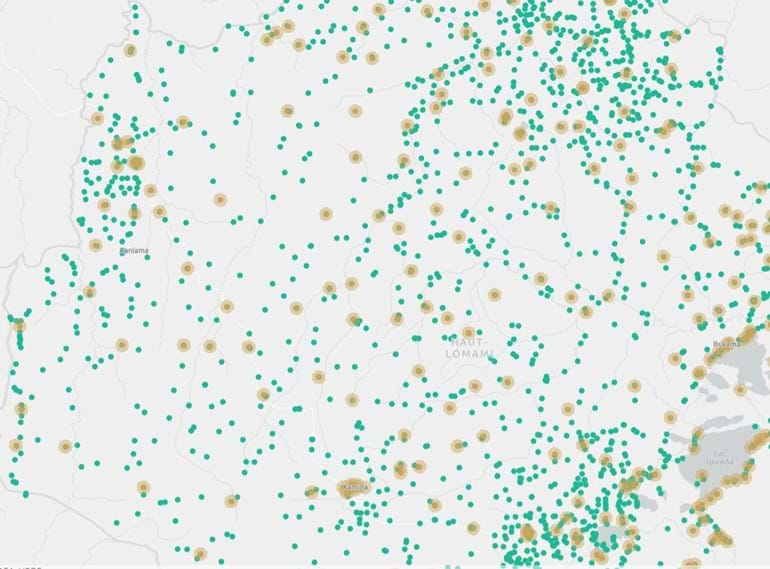
Spotlight | Before and after optimal placement of vaccination sites in Haut Lomami, DRC.
Applications
We applied our optimal service solution in various projects and sectors across the years, including for financial inclusion in Tanzania; education in Nigeria and Sierra Leone (both funded by the GRID3 programme); or supporting childhood immunisation interventions in the Democratic Republic of the Congo for our GRID3 Mapping for Health project.
Discover some of our case studies below:
Storymap: Informing placement policies with an optimisation algorithm
Discover an overview of our various site optimisation projects in this interactive ArcGis online storymap
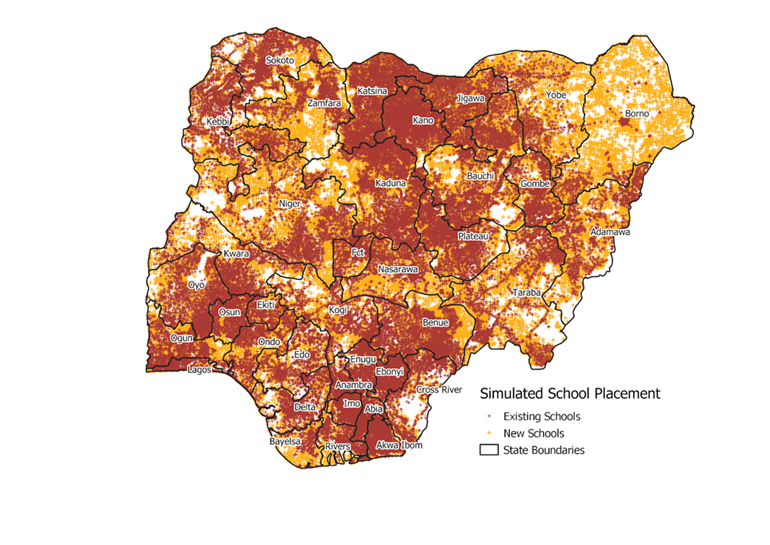
Improving access to education in Nigeria through school placement optimisation
Read how Flowminder harnessed geospatial data to understand access to education in Nigeira, and model suitable locations for new schools.
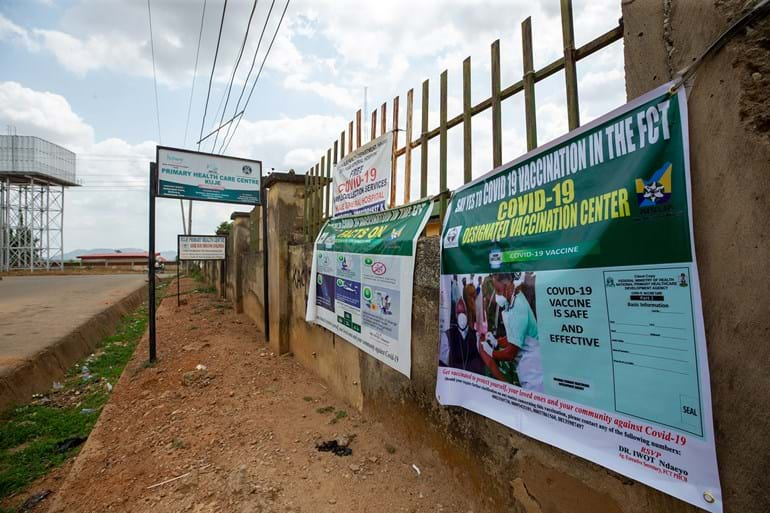
Modelling optimal site placement for COVID-19 vaccination in Nigeria
Read how Flowminder, under the GRID3 programme, helped the Nigerian government in determining where to add new COVID-19 vaccination sites to maximise population coverage.
Our approach
Our optimisation method relies on gridded population estimates (the estimated counts of the population for a given area at a resolution of approximately 100 x 100m), the coordinates of the existing facilities or services and the service radius of the new site coverage area (the distance the new feature should cover).
Once the service radius is decided, we can assess the coverage of existing services and the density of the uncovered population and create a map of the population not yet covered by existing facilities within the service radius distance (X km). Our algorithm then places facilities on all locations with the largest number of uncovered people within X km and that are sufficiently far from each other, so that the placement of one facility does not affect the placement of another (no overlapping coverage).


Supporting decision-making
In addition, to foster a deeper understanding of the problem of maximising population coverage and providing sufficient service capacity, and to evaluate whether context-specific constraints need to be taken into account (e.g. type of suitable locations, distribution of target populations), we provide users with the ability to quickly visualise simulations for different scenarios.
By viewing a range of different solutions to their problem of spatial expansion of service points or staff, we believe decision makers can more precisely plan with respect to potential expenditure and the equity of access to services.
Contact us to discuss how we can support:
Results
For best resource allocation results, our method provides different solutions, based on the needs of our users, their sector, resources, constraints, and environment:
-
When we know how many sites to add
If users know how many sites they want to add, based on their budget and resources, then the results of the algorithm will inform them on how many people the sites can maximally cover, and on where to place the sites to reach this maximum coverage.
-
When we need to refine the number of sites to place
Alternatively, if users first need to determine or refine the number of additional sites to place (in practice, this is the most common situation), then the algorithm results will inform them on the maximum total number of people they can cover depending on how many sites they add (cumulated coverage), and on whether each new site suggested covers a sufficient amount of additional people (additional coverage) for its placement to be justified and viable. Users can then quantify tradeoffs between costs and benefits and determine the number of sites worth adding.
-
When we want to change priority categories
Optionally, users can also determine priority categories, to specify where limited resources should be directed first. This may be of use in situations when sites are added in phases over time or when sites need to be visited at different frequencies or have different staff structures.
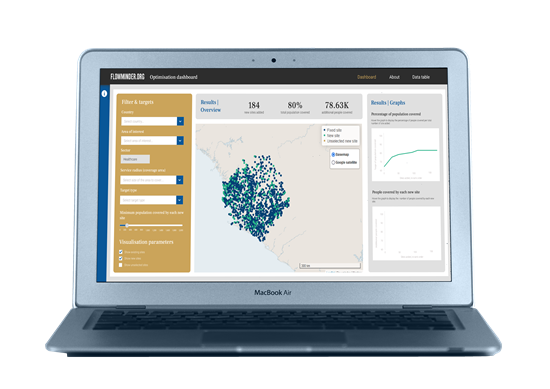
Creating & using data visualisations
Creating visualisations of the algorithm outputs, interactive via an online dashboard, or static, is often essential to support this decision-making process. We produce maps and dashboards using a variety of data visualisation tools, depending on user preferences.
Results can also be shared via csv or a vector file format (such as a geopackage) to feed into in-house dashboards or planning systems.

Spotlight | Optimising service site placement for health purposes in Nigeria
In this short video, Dr Linus Bengtsson, Co-founder and Chairman of the Board at Flowminder, presents how we can optimise the placement of vaccination sites in Nigeria to improve vaccination rates. He introduces the preliminary results of the approach used in 2022 in some of the states across Nigeria, and the value of scaling up the use of our service site placement optimisation solution to bring vaccines to all children in Nigeria.
Considerations & support
Optimisation is meant as a support tool to governments and service planners, not a replacement for decision-making.
It’s important to bear in mind that addressing access does not have to necessarily translate into creating new sites. The outputs from the model can also be used to develop other strategies to support the objectives initially set.
Our insights cater to a wide range of sectors, with track records in the health and education sectors. In addition, we have a team of experts available to guide you throughout the process, validating the data and suggesting improvements or scenarios.